Transport
Transport emissions compared: cars, EVs, trains and planes
Trains, coaches and bikes beat almost everything; flying and driving alone sit at the top. Electric cars cut lifecycle emissions in every major market, by how much depends on the grid.
The short answer: which way of travelling emits the least?
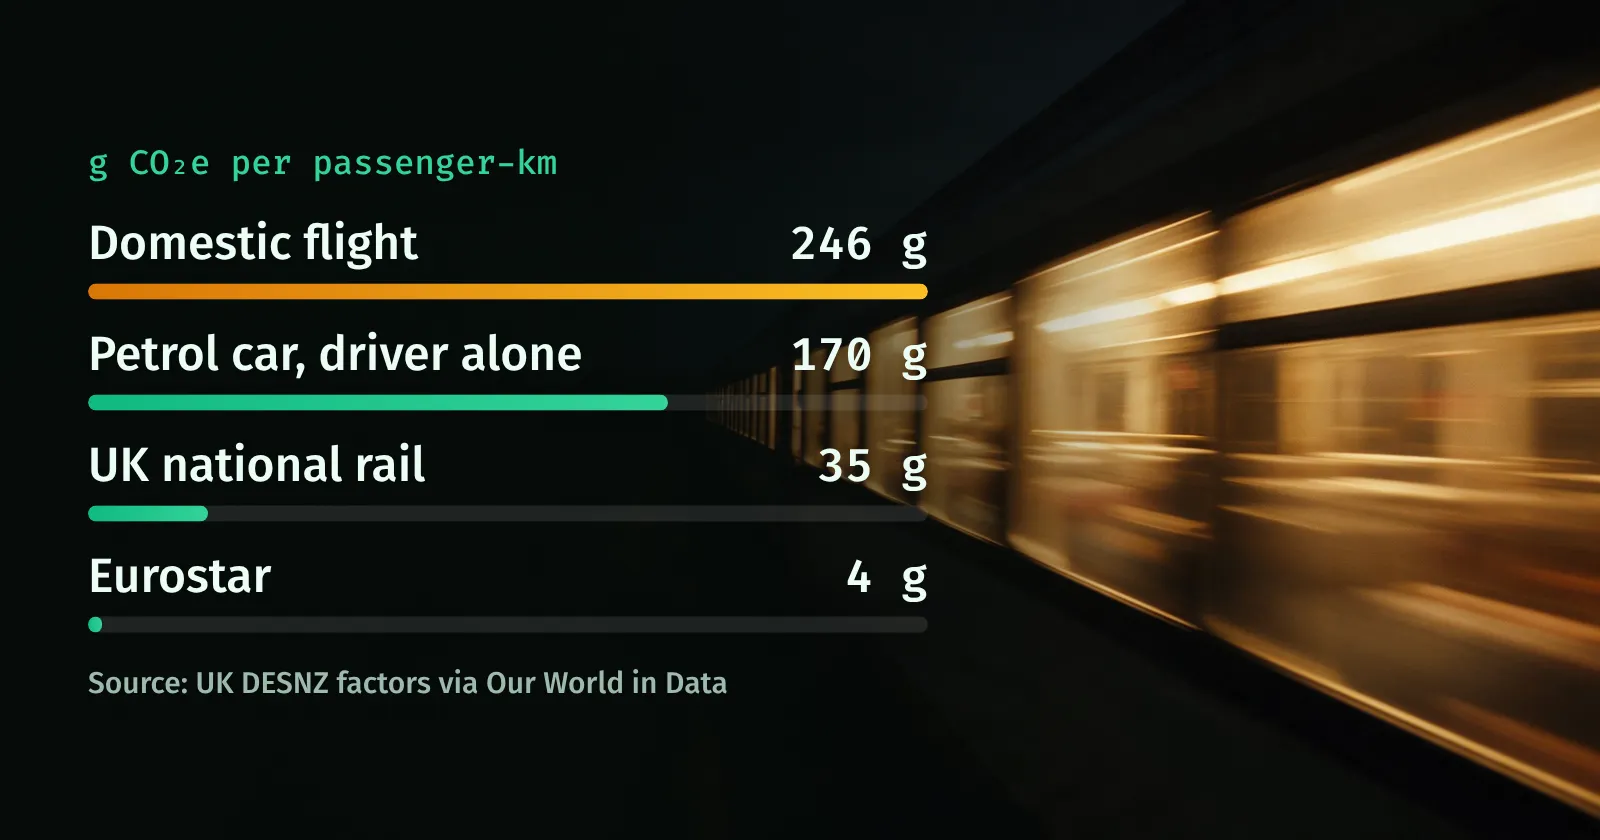
Walking and cycling emit next to nothing. After that, trains and coaches are usually the lowest-carbon way to travel, followed by buses and electric cars. Driving a petrol or diesel car alone and flying, especially short domestic flights, have the highest emissions per passenger-km.
If you own a car, switching to a battery electric model cuts its lifetime emissions substantially: by about 73% for a new car in the EU, and by about half on average worldwide. The cleaner the local electricity grid, the bigger the saving.
Carbon footprint of transport per passenger-km
The most widely used comparison comes from the UK government’s greenhouse gas conversion factors, compiled by Our World in Data. They measure emissions per passenger-kilometre: the CO₂-equivalent for moving one person one kilometre. Flight figures include the extra warming from non-CO₂ effects at altitude.
| Mode | g CO₂e per passenger-km |
|---|---|
| Domestic flight | 246 |
| Diesel car (driver only) | 171 |
| Petrol car (driver only) | 170 |
| Short-haul flight | 154 |
| Long-haul flight | 148 |
| Motorbike | 114 |
| Bus | 97 |
| Electric car (UK electricity, driver only) | 47 |
| National rail (UK) | 35 |
| Ferry (foot passenger) | 19 |
| Eurostar (international rail) | 4 |
| Cycling or walking | ~0 |
These figures are averages, and occupancy changes everything. Four people sharing a petrol car bring it down to about 43 g each, close to a train. A near-empty bus can emit more per passenger than a full car.
UK electricity has also become cleaner since 2022. In the government’s 2026 factor set, the grid electricity factor fell by about 26% to 0.131 kg CO₂e per kWh, and the factors for electric cars and national rail fell accordingly.
Electric car vs petrol car: lifecycle emissions
Comparing tailpipes alone flatters electric cars, so the fairest comparison is the full lifecycle: building the car and battery, producing the fuel or electricity, driving, maintenance and end-of-life. The International Council on Clean Transportation (ICCT) has done the most detailed studies of this.
| Powertrain | Lifecycle g CO₂e/km | vs petrol |
|---|---|---|
| Petrol | 235 | – |
| Hybrid (HEV) | ~190 | about −20% |
| Plug-in hybrid (PHEV) | ~165 | about −30% |
| Battery electric (EU grid mix) | 63 | −73% |
| Battery electric (renewable electricity only) | ~52 | up to −78% |
Building an electric car does create more emissions, mostly from the battery: about 40% more than a combustion car in the ICCT’s analysis. That extra is paid back after about 17,000 km of driving. Plug-in hybrids save less than their official figures suggest, because many are driven on petrol more often than assumed.
Other regions show the same direction with different sizes. The ICCT’s 2021 global study found battery electric cars registered that year had lifecycle emissions 66–69% lower than petrol cars in Europe, 60–68% lower in the United States, 37–45% lower in China and 19–34% lower in India. The IEA’s Global EV Outlook puts the global average at about half the emissions of an equivalent petrol car over 15 years and 200,000 km.
How the electricity grid changes EV emissions
An electric car is only as clean as the electricity that charges it. The table below shows the carbon intensity of electricity in 2025 and an illustrative figure for charging emissions, assuming a typical car uses about 0.18 kWh per km including charging losses.
| Grid | g CO₂e per kWh | Approx. g CO₂e per km charging |
|---|---|---|
| India | 670 | ~120 |
| China | 525 | ~95 |
| World average | 458 | ~80 |
| United States | 384 | ~70 |
| European Union | 210 | ~40 |
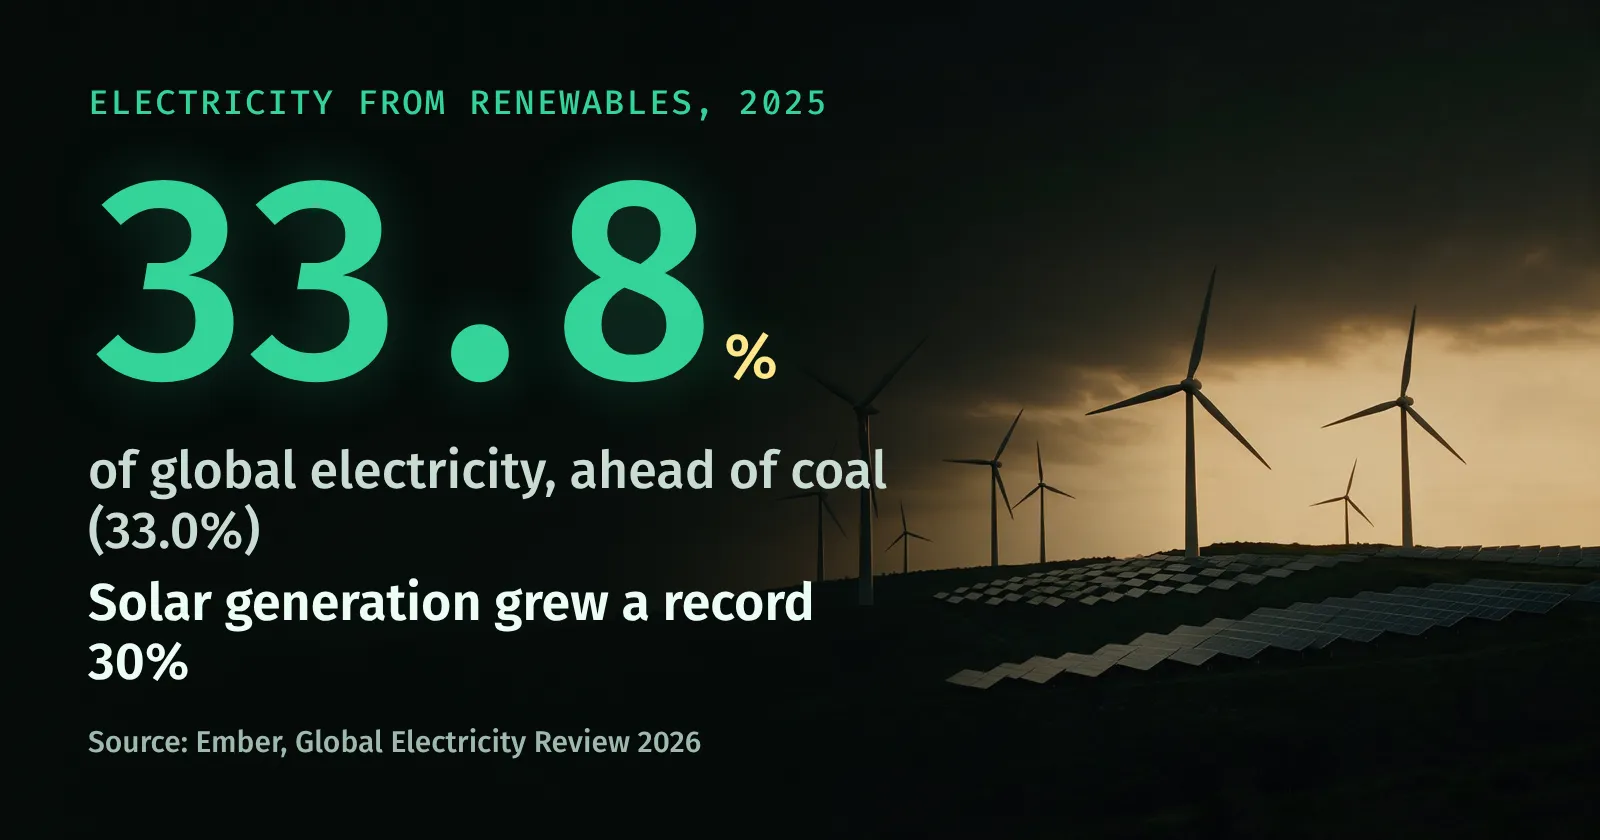
Even on India’s coal-heavy grid, charging an EV emits less per km than burning petrol (about 170 g per km for a petrol car’s fuel alone). And because grids are getting cleaner every year, an EV bought today gets cleaner as it ages, while a petrol car does not. You can see how each country’s emissions are changing on the CO₂ emissions by country ranking, including India and the United States.
Charging at home with rooftop solar or on a renewable tariff pushes the figure lower still. Our renewable energy guide explains the options.
How many electric cars are being sold?
More than 20 million electric cars were sold worldwide in 2025, about a quarter of all new cars, according to the IEA’s Global EV Outlook 2026. The IEA counts both battery electric and plug-in hybrid cars as electric.
- China: more than 13 million sales, six in ten electric cars sold globally, and nearly 55% of its car market. In the second quarter of 2026 the share passed 60%. China also builds most of the world’s EVs and batteries; see China’s CO₂ emissions.
- Europe: 4.2 million sales, 28% of new cars.
- United States: just under 10% of new car sales.
In the first half of 2026 electric cars made up 24% of global car sales, and the IEA expects about 29% for the full year.
How much does flying contribute to climate change?
Aviation produces about 2.5% of global CO₂ emissions, just under a billion tonnes a year according to Our World in Data. But planes also cause warming through contrails, nitrogen oxides and water vapour at altitude. Including these effects, Lee et al. (2021) estimated aviation was responsible for about 3.5% of human-caused warming effects in 2018, with roughly two-thirds coming from non-CO₂ effects. The non-CO₂ estimates carry large uncertainty.
Per person, flying is often the largest single item in a frequent traveller’s footprint:
- A return economy flight London–New York (about 11,100 km) produces roughly 1.3–1.7 tonnes of CO₂e per passenger using UK government factors.
- UK government factors attribute about 3.5 times more emissions to a long-haul business-class seat than to economy, because it takes up more space.
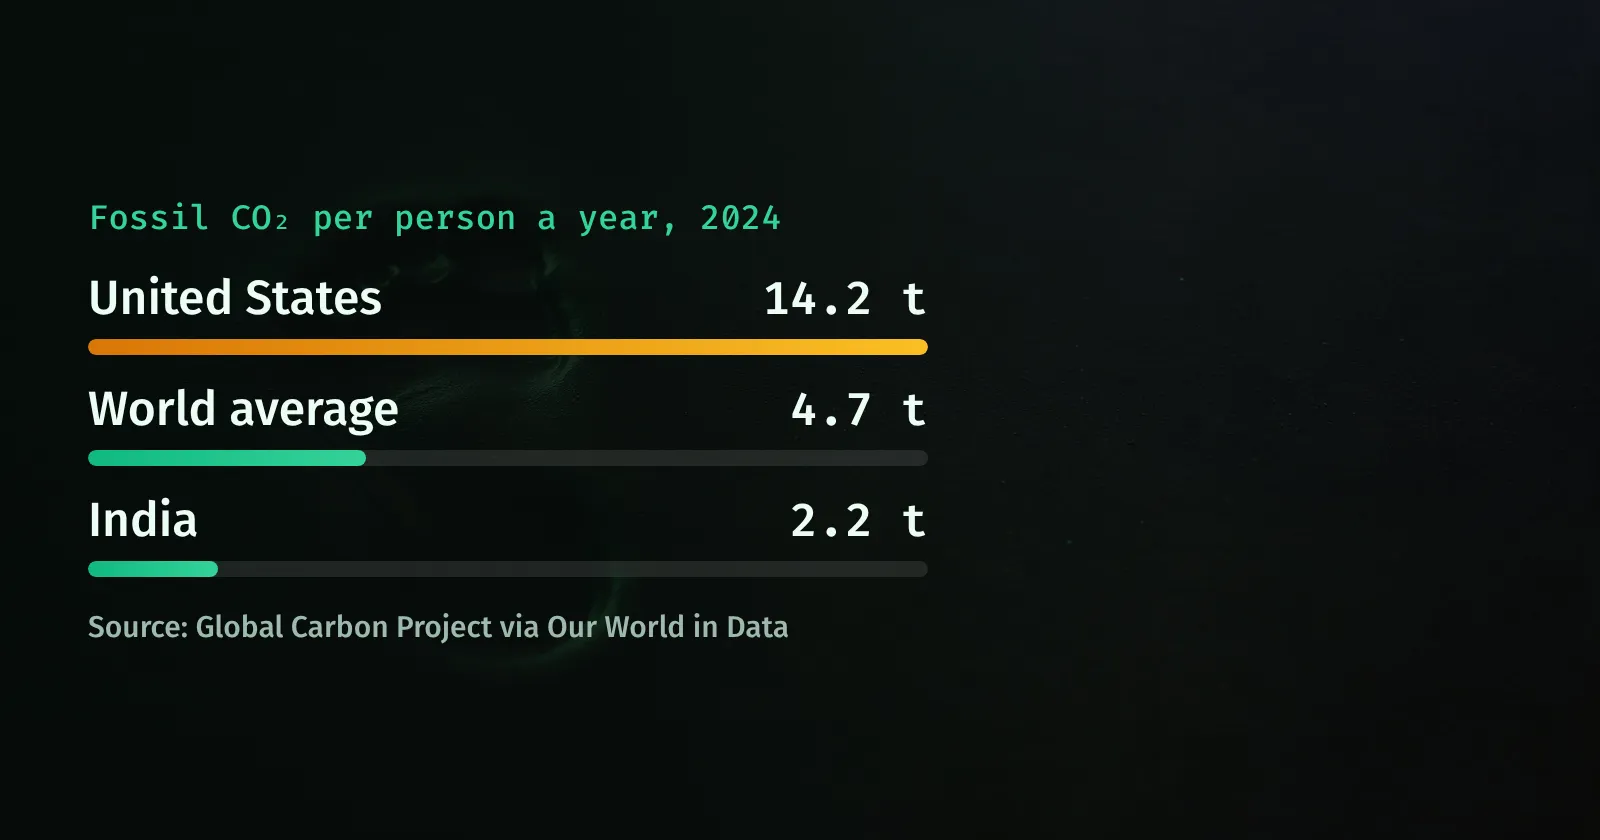
- For comparison, the world average is about 4.7 tonnes of fossil CO₂ per person per year.
Where do transport emissions come from?
Transport accounts for about one-fifth of global CO₂ emissions, nearly 8 billion tonnes a year in IEA data. Road vehicles cause about three-quarters of transport emissions: passenger cars, vans, buses and freight trucks. Aviation and shipping each make up around a tenth, and rail only about 1%.
That means personal car travel is the largest single slice, and also the area where individual choices and electrification make the fastest difference. Watch the global total grow on the live CO₂ emissions counter.
Practical choices and roughly how much they save
The savings below are estimates calculated from the factors above. Your numbers will vary with your car, occupancy and route.
| Change | Approx. saving per year |
|---|---|
| Skip one return long-haul economy flight (London–New York) | 1,300–1,700 kg CO₂e |
| Replace a petrol car with an EV (12,000 km a year, EU lifecycle) | ~2,000 kg CO₂e |
| Commute 20 km a day by train instead of driving alone (220 days) | ~600 kg CO₂e |
| Cycle the same 20 km commute instead of driving | ~750 kg CO₂e |
| Take the train instead of one return domestic flight of ~530 km each way | ~220 kg CO₂e |
| Share your car commute with one other person | half your commute emissions |
- For trips under 5 km, walk, cycle or use an e-bike where it is safe.
- For journeys under about 700 km, check the train before booking a flight.
- Fly economy, fly direct, and take fewer, longer trips.
- When you replace your car, choose a battery electric one, and the smallest that meets your needs.
- Keep tyres inflated, drive smoothly and remove roof boxes when you don’t need them.
To see how transport compares with your home energy and diet, use our carbon footprint calculator guide.
Questions and answers
Is an electric car really better than a petrol car for the climate?
Yes, in every major market studied. The ICCT estimates that a battery electric car sold in Europe in 2025 has about 73% lower lifecycle emissions than a comparable petrol car, including battery manufacturing. The IEA puts the global average at about half. The gap is smallest on coal-heavy grids and grows as grids get cleaner.
Is it better to take the train or fly?
The train, by a wide margin. UK government factors compiled by Our World in Data put national rail at about 35 g CO₂e per passenger-km and a domestic flight at about 246 g, roughly seven times more. Eurostar is about 4 g per passenger-km against 154 g for a short-haul flight.
How much CO₂ does a long-haul flight produce?
A return economy flight between London and New York (about 11,100 km) works out at roughly 1.3–1.7 tonnes of CO₂e per passenger using UK government factors that include non-CO₂ effects. A business-class seat is responsible for about 3.5 times as much as an economy seat.
What share of global emissions comes from transport?
About one-fifth of global CO₂ emissions, or nearly 8 billion tonnes a year. Road transport (cars, vans, buses and trucks) makes up about three-quarters of that, with aviation and shipping each around a tenth.
How long does it take an EV to pay back its battery emissions?
Building an EV produces more emissions than building a petrol car, mainly because of the battery. In the ICCT’s 2025 European analysis, that extra is offset after about 17,000 km of driving, typically one to two years of use.
Sources
- Which form of transport has the smallest carbon footprint?, Our World in Data (UK DESNZ 2022 factors)
- Carbon footprint of travel per kilometer, Our World in Data
- Greenhouse gas reporting: conversion factors 2025 and 2026, UK Department for Energy Security and Net Zero
- Life-cycle greenhouse gas emissions from passenger cars in the European Union: a 2025 update, ICCT, 2025
- A global comparison of the life-cycle greenhouse gas emissions of combustion engine and electric passenger cars, ICCT, 2021
- Global EV Outlook 2024: Outlook for emissions reductions, IEA, 2024
- Global EV Outlook 2026: Trends in electric cars, IEA, 2026
- Electric Car Markets in a Time of Uncertainty, IEA, 2026
- Global Electricity Review 2026, Ember, 2026
- Cars, planes, trains: where do CO₂ emissions from transport come from?, Our World in Data
- What share of global CO₂ emissions come from aviation?, Our World in Data
- The contribution of global aviation to anthropogenic climate forcing for 2000 to 2018, Lee et al., Atmospheric Environment, 2021