How-to
Carbon tracking: how to track carbon emissions, from your home to a whole company
Carbon tracking means turning what you use into tonnes of CO₂. Here is how it works, how to do it for yourself or a business, and how much “real time” is really possible.
What is carbon tracking?
Carbon tracking is measuring or estimating the greenhouse gases behind an activity and following that number over time. The result is usually given in kilograms or tonnes of CO₂, or CO₂e (CO₂-equivalent) when other gases such as methane are included.
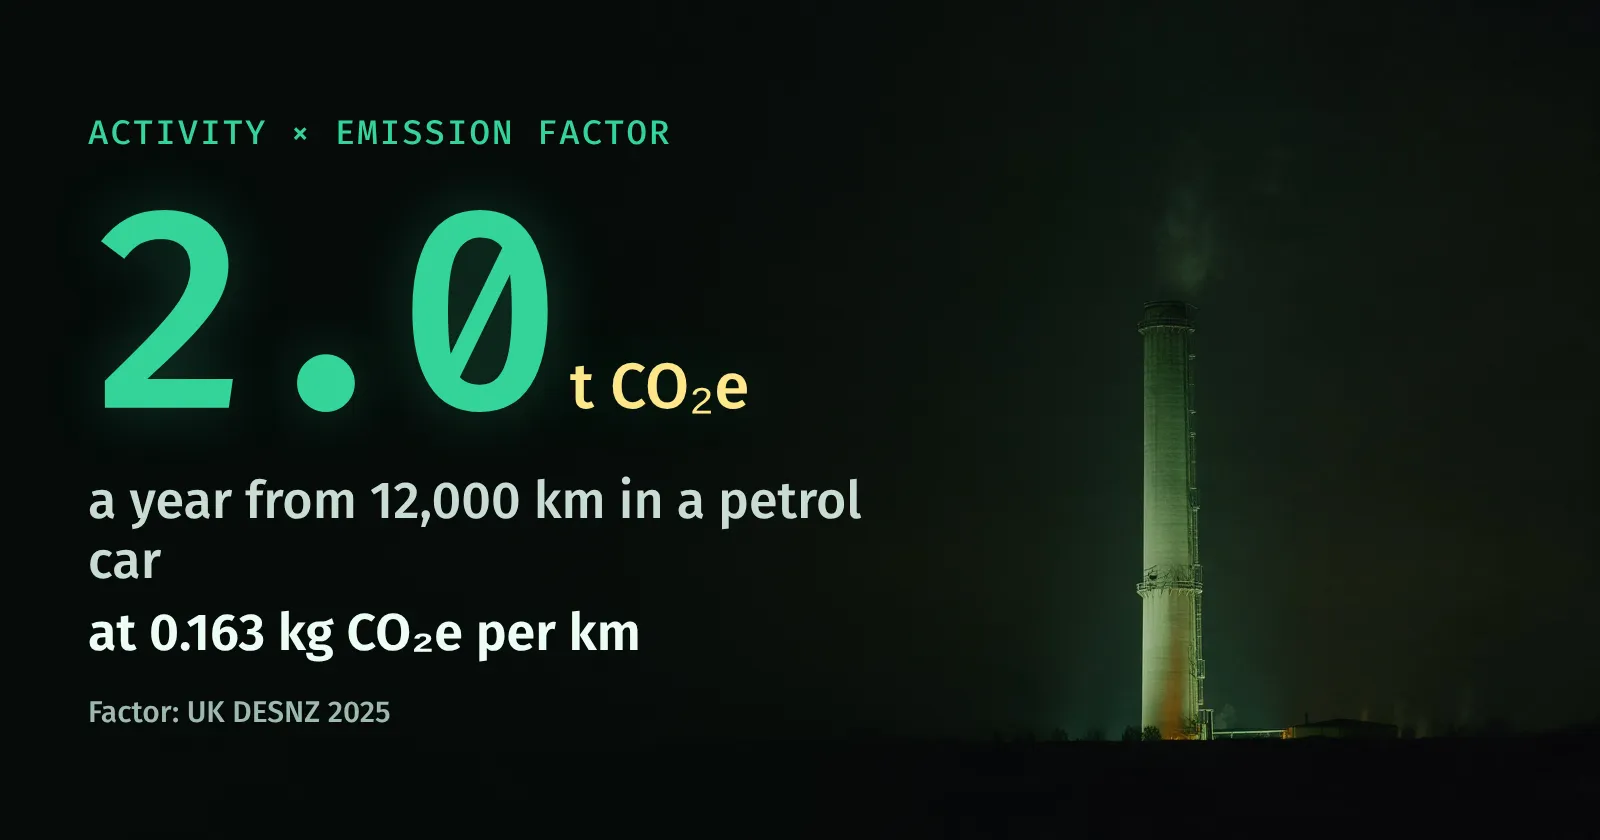
Almost all carbon tracking, from a household to a multinational, uses the same formula:
For example, driving 12,000 km in an average petrol car at 0.163 kg CO₂e per km (UK DESNZ 2025) gives about 1,960 kg, or 2.0 tonnes, a year. The live global CO₂ counter uses the same idea at planetary scale: the world’s yearly total of 42.2 billion tonnes, spread evenly over every second.
How to track your personal carbon footprint
Five numbers cover most of a typical footprint in a high-income country. You can find all of them in about ten minutes:
| What | Where to find it | Factor |
|---|---|---|
| Car | Annual mileage from your service record or MOT/inspection history | 0.163 kg/km (petrol) |
| Flights | Booking emails for the past year | ≈1.6 t per long-haul return |
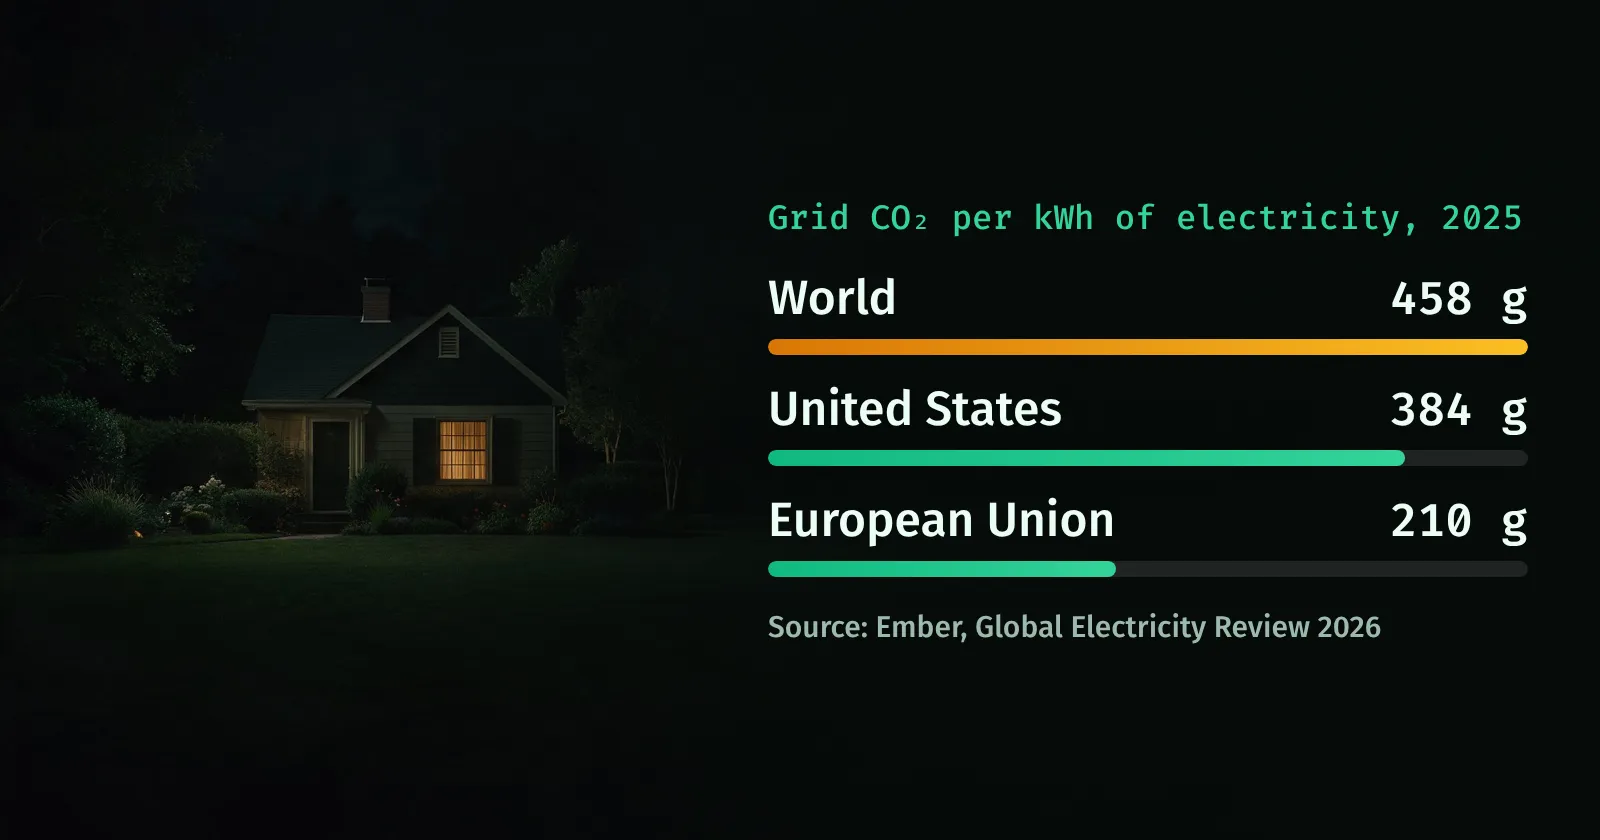
| Electricity | Annual kWh on your bill or supplier app | 458 g/kWh world average (Ember) |
| Heating | Gas kWh on your bill, or litres of oil or LPG delivered | 0.183 kg/kWh (gas) |
| Food | Your typical diet | 1.0–2.6 t a year |
- Collect one year of data, so seasons even out.
- Enter it in a calculator that shows its emission factors. Our carbon footprint calculator takes about two minutes and lists the three changes that would cut your total most.
- Track monthly where it’s easy. Smart meters and energy apps show electricity and gas use by day or hour; see how to track your home energy use.
- Repeat once a year with the same method, and compare categories rather than chasing decimals.
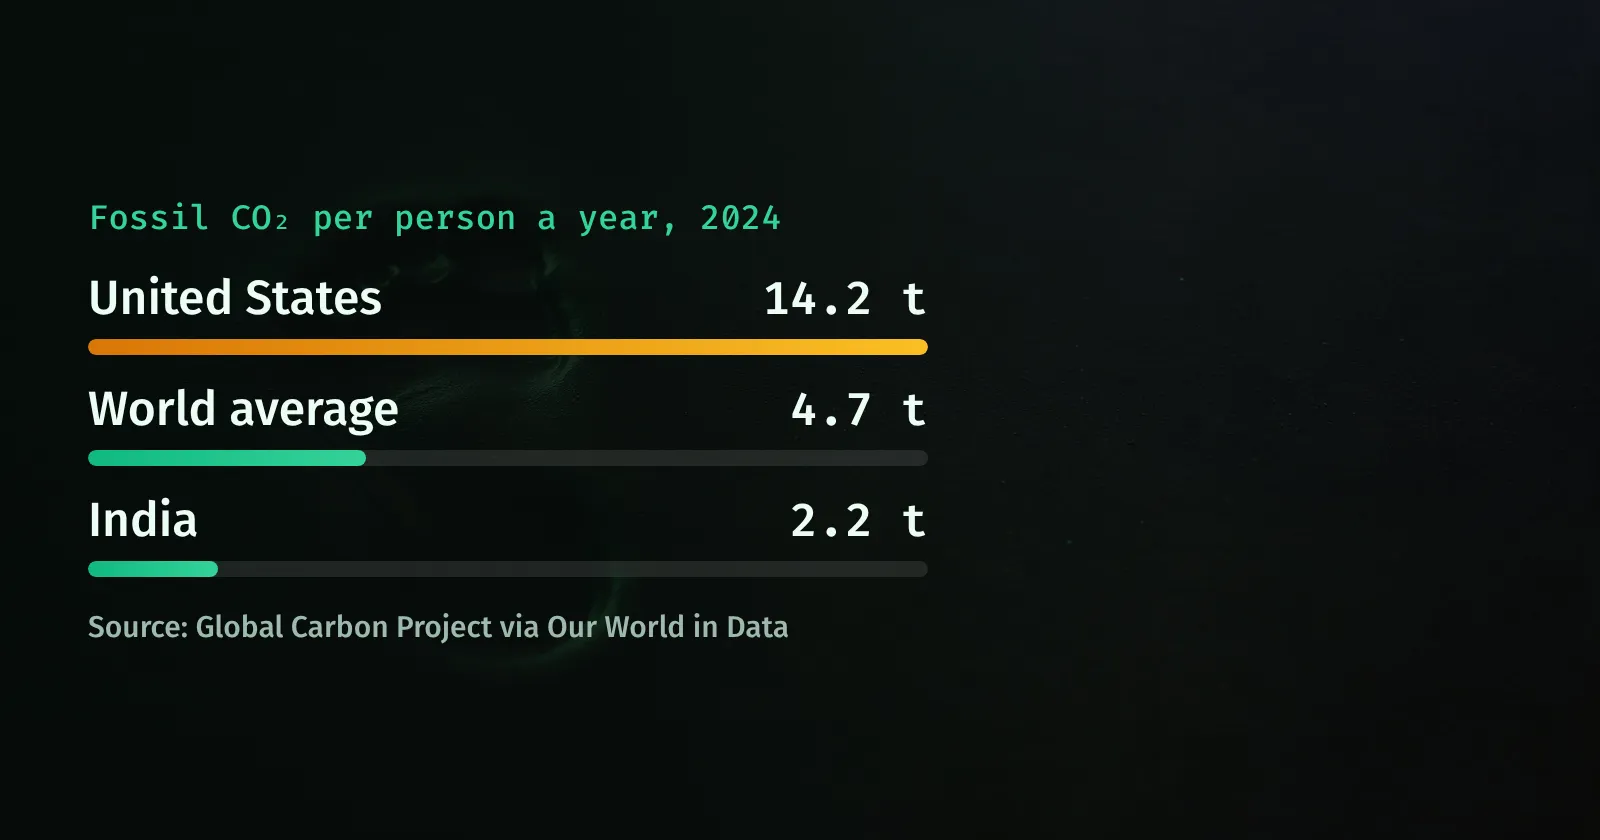
For context, the world average is about 4.7 tonnes of fossil CO₂ per person a year, but it ranges from well under 1 tonne in many low-income countries to over 14 tonnes in the United States. You can compare countries in the CO₂ per person ranking.
How to track carbon emissions in a business
Organisations track emissions with the Greenhouse Gas Protocol, the standard behind most corporate climate reporting. It splits emissions into three scopes (for a deeper look with examples, see scope 1, 2 and 3 emissions explained):
| Scope | What it covers | Typical data |
|---|---|---|
| Scope 1 | Fuel burned on site and in company vehicles, plus process and refrigerant leaks | Gas and fuel invoices, fleet fuel cards, refrigerant logs |
| Scope 2 | Purchased electricity, heat, steam and cooling | Utility bills and meters, energy contracts |
| Scope 3 | The rest of the value chain, in 15 categories: purchased goods, transport, business travel, commuting, use and disposal of sold products and more | Spend data, supplier figures, travel bookings, product data |
A practical way to start:
- Set the boundary. Decide which sites, subsidiaries and vehicles count, and pick a base year.
- Measure scopes 1 and 2 first. The data is in invoices you already have, and it is usually accurate to a few percent. For electricity, the GHG Protocol asks for two figures: a location-based one using the grid average, and a market-based one that reflects renewable contracts.
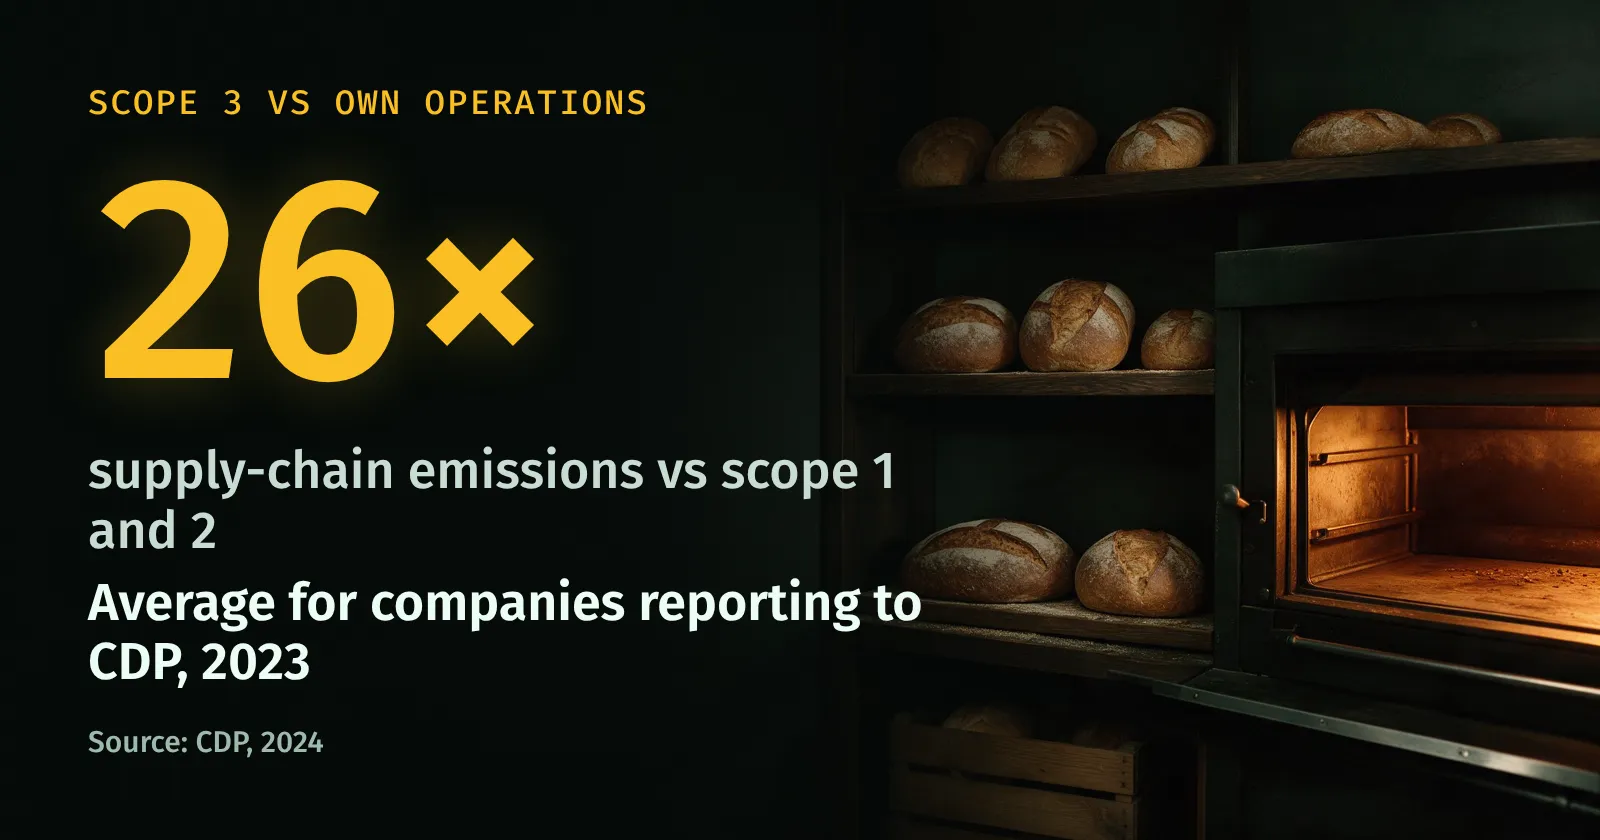
- Screen scope 3. Estimate every category roughly, often from spend data, then improve the largest ones with real supplier data. For most companies, scope 3 is the biggest part of the footprint.
- Choose emission factors and document them: for example the UK government’s annual conversion factors or the US EPA Emission Factors Hub. Use the same sources every year.
- Report and set targets. A growing number of disclosure rules, including the EU’s Corporate Sustainability Reporting Directive and the ISSB’s climate standard, build on the GHG Protocol, so tracking it well now saves work later.
Real-time carbon tracking: is it possible?
Partly. It helps to separate what is actually measured as it happens from what is estimated:
- Power plant stacks: large US power plants measure CO₂ continuously and report hourly data, published through the EPA’s Clean Air Markets Program Data.
- Electricity grids: Great Britain’s grid operator publishes carbon intensity every half hour with a forecast, and Electricity Maps shows live estimates for many countries. Useful for timing laundry, EV charging or data-centre work.
- Smart meters: they record your home’s electricity and gas use every half hour or hour; multiply by a factor to get near-real-time household emissions.
- Daily national estimates: Carbon Monitor estimates CO₂ emissions by country and sector each day from power, traffic and industry data.
- Facility-level estimates: Climate TRACE combines satellite imagery and machine learning to estimate emissions from millions of individual sources.
- Satellites: NASA’s OCO-2 measures CO₂ concentrations in the air, not emissions directly; turning them into emissions takes modelling.
Global totals are different: the Global Carbon Budget is published once a year. A live CO₂ tracker such as ours spreads that yearly estimate over every second, so it shows the expected running total, not a measurement. How the counter works explains the method and its uncertainty.
What to look for in a carbon tracking tool or dashboard
- It shows its emission factors and sources, with the year. A tool that hides them can’t be checked.
- It uses your real activity data (kWh, litres, km) rather than spending alone where you have it.
- It follows the GHG Protocol scopes and reports location- and market-based electricity separately.
- It keeps an audit trail: who entered what, from which invoice, and when factors changed.
- It shows trends, not just a total: by month, site and category, so you can see what is working.
- It exports your data in an open format, so you are not locked in.
For a household, a spreadsheet plus our calculator is enough. Small businesses often manage scopes 1 and 2 in a spreadsheet too; dedicated carbon accounting software earns its cost once scope 3 data, multiple sites or audits come in.
Common carbon tracking mistakes
- Mixing units: kWh and MWh, miles and kilometres, CO₂ and CO₂e. Write the unit next to every number.
- Using an old or wrong-country factor: grid factors change every year as renewables grow; the UK’s fell to about 126 g/kWh in 2025, while the world average is about 458 g.
- Double counting: counting electric car charging in both “car” and “electricity”, or a supplier’s emissions in two scope 3 categories.
- Changing the method every year, which makes progress impossible to see. If you must change it, restate the base year.
- Chasing precision on small items while estimating the biggest category roughly. Spend your effort where the tonnes are.
Want to see the big picture? Watch the world’s emissions add up on the live CO₂ counter, or compare countries in the CO₂ emissions by country ranking.
Questions and answers
What is carbon tracking?
Carbon tracking is measuring or estimating the greenhouse gases caused by an activity, a household or an organisation, usually in tonnes of CO₂ or CO₂-equivalent (CO₂e), and following the number over time. Most tracking multiplies activity data, such as kWh of electricity or kilometres driven, by an emission factor.
How do I track my own carbon emissions?
Collect a year of electricity and heating bills, your car’s annual distance and your flights, then multiply each by an emission factor. Our free carbon footprint calculator does the arithmetic and shows which category is largest.
How do companies track carbon emissions?
They follow the Greenhouse Gas Protocol: scope 1 covers fuel burned on site and in company vehicles, scope 2 covers purchased electricity, heat and steam, and scope 3 covers the rest of the value chain, from purchased goods to the use of sold products. Data comes from meters, invoices, travel systems and supplier information, multiplied by published emission factors.
Is real-time carbon tracking possible?
Partly. Large power plants measure stack emissions continuously, and grid operators such as Great Britain’s publish electricity carbon intensity every half hour. Almost everything else, including national and global totals, is estimated from fuel and activity data and published weeks to months later. Live counters like ours spread those estimates over time.
What is the best carbon tracking tool?
For individuals, a calculator that uses your real kWh and kilometres, plus your energy supplier’s smart-meter data, is enough. Businesses usually start with a spreadsheet and move to carbon accounting software once scope 3 data and audit requirements grow. Look for tools that show their emission factors and follow the GHG Protocol.
Sources
- GHG Protocol Corporate Accounting and Reporting Standard, World Resources Institute and WBCSD
- GHG Protocol Scope 2 Guidance, World Resources Institute and WBCSD, 2015
- GHG Protocol Corporate Value Chain (Scope 3) Standard, World Resources Institute and WBCSD
- Greenhouse gas reporting: conversion factors 2025, UK Department for Energy Security and Net Zero, 2025
- GHG Emission Factors Hub, US Environmental Protection Agency
- Clean Air Markets Program Data (power plant emissions), US Environmental Protection Agency
- Carbon Intensity API for Great Britain, National Energy System Operator
- Electricity Maps: live carbon intensity of electricity
- Carbon Monitor: near-real-time daily CO₂ emissions estimates
- Climate TRACE: independent emissions inventory
- Orbiting Carbon Observatory-2 (OCO-2), NASA Jet Propulsion Laboratory
- Global Carbon Budget 2025, Global Carbon Project, 2025
- Global Electricity Review 2026, Ember, 2026