How-to
Carbon footprint calculator: estimate yours in 2 minutes
Enter how you travel, heat your home and eat. You get your yearly footprint in tonnes of CO₂e, a breakdown by category and the three changes that would cut it most.
Estimate your carbon footprint in two minutes
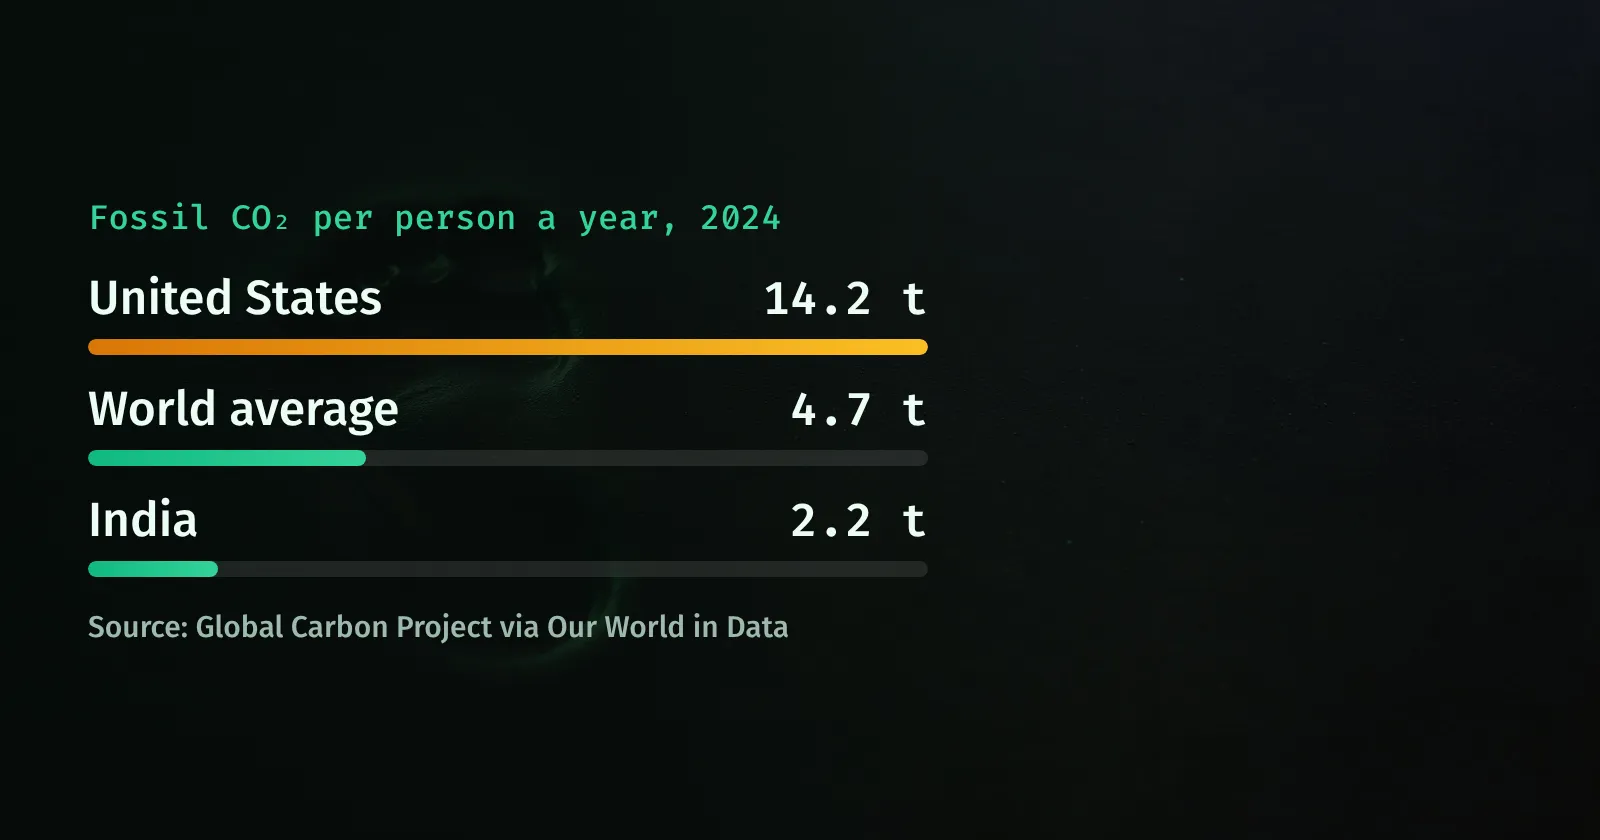
The average person on Earth is responsible for about 4.7 tonnes of fossil CO₂ a year, but that average hides a huge spread: about 14.2 t in the United States, 4.5 t in the UK and 2.2 t in India. To stay in line with the 1.5 °C goal, lifestyle footprints need to fall to roughly 2–2.5 t CO₂e per person by 2030.
Fill in the calculator below with your own numbers. It updates as you type, shows which category dominates and suggests the three changes that would cut your footprint most. Your bills give the most accurate kWh figures, but the defaults are sensible starting points.
Your estimated footprint
– t CO₂e a year
Turn on JavaScript to see your result.
Your three biggest wins
A rough, per-person estimate. The world average counts fossil CO₂ produced inside each country, so the comparison is indicative, not like-for-like.
What is a carbon footprint?
A carbon footprint is the total greenhouse gas emitted because of what you do and buy in a year, expressed in tonnes of CO₂ equivalent (CO₂e). Methane and nitrous oxide, which matter a lot for food and flights, are converted into the amount of CO₂ that would cause the same warming over 100 years.
It has two parts. Direct emissions come from fuel you burn yourself: petrol in your car, gas in your boiler. Indirect emissions happen elsewhere on your behalf: at the power station that makes your electricity, on the farm that grows your food and in the factory that made your phone.
What is the average carbon footprint per person?
Measured as fossil CO₂ produced within each country, the world average was 4.7 t per person in 2024, according to the Global Carbon Project data published by Our World in Data. Countries with large homes, long car journeys and fossil-heavy power grids sit three to four times higher.
| Country | t CO₂ per person |
|---|---|
| Saudi Arabia | 20.4 |
| Australia | 14.5 |
| United States | 14.2 |
| Canada | 13.4 |
| South Korea | 11.3 |
| China | 8.7 |
| Japan | 7.8 |
| Germany | 6.8 |
| World average | 4.7 |
| United Kingdom | 4.5 |
| France | 4.0 |
| Brazil | 2.3 |
| India | 2.2 |
You can compare any other country in the CO₂ emissions by country ranking.
A lifestyle (consumption-based) footprint, which includes all greenhouse gases and the emissions embedded in imports, gives a fuller picture. The Hot or Cool Institute estimates about 8.5 t CO₂e a year for a typical UK resident, nearly twice the UK’s production-based 4.5 t. Earlier work by IGES and Aalto University found 10.4 t in Finland, 7.6 t in Japan, 4.3 t in China, 2.8 t in Brazil and 2.0 t in India.
What footprint should you aim for?
The UN Environment Programme’s Emissions Gap Report 2020 says meeting the 1.5 °C goal requires lifestyle footprints of around 2–2.5 t CO₂e per person by 2030. The 1.5-Degree Lifestyles research sets the path beyond that at 1.4 t by 2040 and 0.7 t by 2050. The calculator compares your result with the 2.5 t figure for 2030.
That is a steep drop for most people in rich countries, and much of it depends on cleaner power grids, transport and buildings, not personal choices alone. The IPCC finds that global greenhouse gas emissions need to fall by about 43% from 2019 levels by 2030 to keep 1.5 °C within reach.
What makes up a typical carbon footprint?
Across the countries studied in the 1.5-Degree Lifestyles research, three areas make up roughly 75% of a lifestyle footprint: food, housing (heating and electricity) and personal transport. Goods, leisure and services make up the rest.
- Transport: driving 12,000 km a year in an average petrol car emits about 2.0 t CO₂e. One long-haul return flight adds about 1.6 t.
- Home energy: a typical UK gas-heated home burns about 11,500 kWh of gas, or about 2.1 t CO₂e a year, shared between the people who live there. Electricity depends heavily on the grid: 3,000 kWh is about 0.4 t in the UK but 1.4 t on the world-average grid.
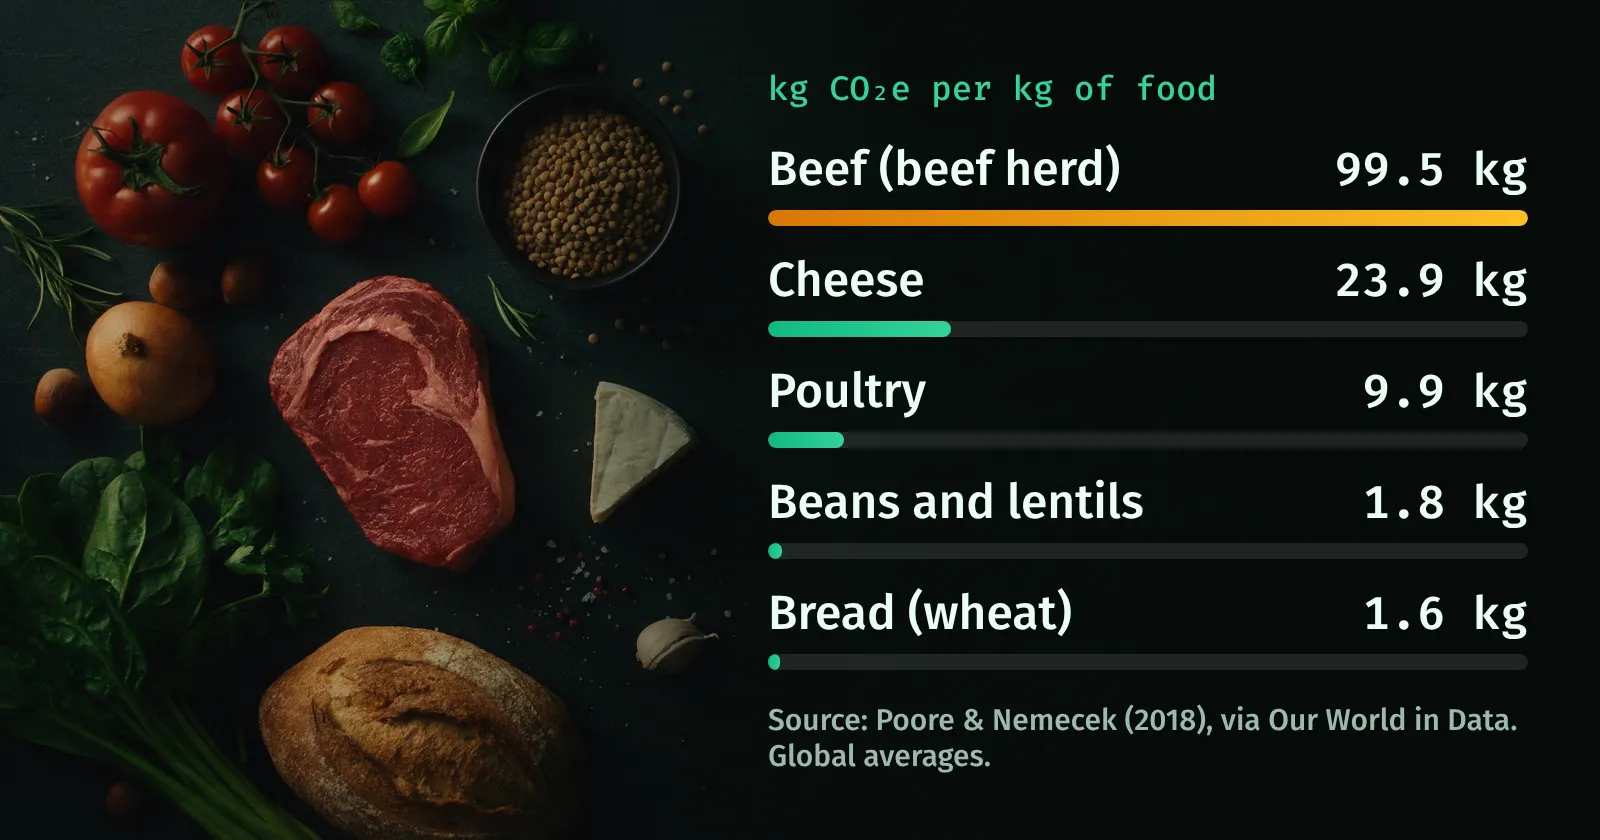
- Food: UK diets range from about 2.6 t CO₂e a year for high meat-eaters to about 1.1 t for vegans. A 2023 follow-up study of 55,504 people found vegans’ dietary emissions were about a quarter of high meat-eaters’.
- Shopping and services: clothes, electronics, furniture, insurance, eating out and the rest. Usually around a quarter of the total and the hardest part to measure.
The biggest single items are usually flights and car use. That is why two households with similar incomes can end up with very different footprints.
How the calculator works
Each answer is multiplied by an emission factor and the results are added up. Home electricity and heating are divided by the number of people in your home. All factors come from the most recent sources we could verify.
| Input | Factor | Source |
|---|---|---|
| Petrol car, average | 0.163 kg/km | UK DESNZ 2025 |
| Diesel car, average | 0.173 kg/km | UK DESNZ 2025 |
| Hybrid car, average | 0.128 kg/km | UK DESNZ 2025 |
| Electric car | 0.2 kWh/km × grid | US DOE (about 32.6 kWh per 100 miles) |
| Short-haul flight, economy, return (2 × 1,200 km) | 0.126 kg/km · 0.30 t | UK DESNZ 2025, with radiative forcing |
| Long-haul flight, economy, return (2 × 7,000 km) | 0.117 kg/km · 1.64 t | UK DESNZ 2025, with radiative forcing |
| Electricity, world average | 458 g/kWh | Ember, 2025 data |
| Electricity, United States | 384 g/kWh | Ember |
| Electricity, EU average | 170 g/kWh | IEA, 2025 |
| Electricity, United Kingdom | 126 g/kWh | Carbon Brief, 2025 |
| Electricity, mostly renewable or nuclear | 20 g/kWh | RTE, France 2025 (19.6 g) |
| Natural gas (gross calorific value) | 0.183 kg/kWh | UK DESNZ 2025 |
| Heating oil (burning oil) | 0.247 kg/kWh | UK DESNZ 2025 |
| LPG | 0.214 kg/kWh | UK DESNZ 2025 |
| Diet: high / medium / low meat | 2.62 / 2.05 / 1.70 t | Scarborough et al. 2014 |
| Diet: pescatarian / vegetarian / vegan | 1.43 / 1.39 / 1.05 t | Scarborough et al. 2014 |
| Shopping and other: low / medium / high | 1.0 / 2.0 / 3.5 t | Our assumption (see below) |
A few choices are worth knowing about:
- Flights include radiative forcing. Contrails and nitrogen oxides at altitude add warming beyond the CO₂ itself. The UK government publishes factors with and without this effect; leaving it out would cut flight emissions by roughly 40%.
- Diet figures are the UK study’s kg CO₂e per 2,000 kcal per day (7.19 for high meat-eaters down to 2.89 for vegans), multiplied by 365.
- Electric cars are counted on electricity use only. Including battery manufacturing, the ICCT estimates a battery-electric car on the EU average grid at about 63 g CO₂e per km over its life, still far below a petrol car.
- Shopping and other is set so that “medium” (2 t) is about a quarter of the UK’s 8.5 t lifestyle footprint, matching the share outside food, housing and transport. Low and high are round numbers either side. Treat this line as the least precise.
- Suggestions use the same factors. Heating savings use the IEA’s estimate that each 1 °C lower saves about 7% of heating energy and Nesta’s estimate that a 60 °C boiler flow temperature saves about 9% of gas.
Why carbon footprint calculators give different answers
Run your details through three calculators and you will probably get three different numbers. That does not mean any of them is wrong. They usually differ in four ways:
- Scope. Some count only CO₂ from energy, others all greenhouse gases plus the emissions embedded in everything you buy. Consumption-based results are higher in rich countries.
- Emission factors and their vintage. The UK government’s 2025 flight factors fell by between 16% and 42% compared with 2024, because the 2024 set used 2021 data when half-empty planes inflated emissions per passenger.
- Electricity location. A kWh is about 126 g CO₂ in the UK and 458 g on the world-average grid. A calculator that uses a national average for a different country can be out by a factor of three.
- Shopping estimates. Most tools convert spending into emissions with average factors per pound or dollar. That is a reasonable guide to scale, but it cannot tell a second-hand sofa from a new one.
How to use your result
Start with the largest bar in your breakdown. Small habits matter far less than a few big decisions, and the research is consistent about which ones those are. A 2020 review of 53 studies by Ivanova and colleagues ranked these among the most effective consumption changes:
- Fly less: dropping one long return flight saves a median of more than 1.7 t CO₂e.
- Switch to renewable electricity: a median saving of 1.6 t CO₂e per person, depending on your grid.
- Live car-free or switch to an electric car: among the top transport options in the review.
- Eat a vegan or mostly plant-based diet: a median saving of about 0.8 t CO₂e.
Once the big items are covered, quicker changes still help, particularly on heating. Our guide to 15 quick ways to reduce your carbon footprint ranks them by how much they actually save.
Then come back in a year and run the same numbers again. Tracking your own trend is more meaningful than any single result.
Questions and answers
What is the average carbon footprint per person?
The world average is about 4.7 tonnes of fossil CO₂ per person a year (2024). It is about 14.2 t in the United States, 8.7 t in China, 4.5 t in the UK and 2.2 t in India. Consumption-based footprints that include all greenhouse gases and imported goods are higher in rich countries, for example about 8.5 t CO₂e in the UK.
How do I calculate my carbon footprint?
Multiply each activity by an emission factor and add them up: kilometres driven × kg CO₂e per km, kWh of electricity × your grid’s intensity, kWh of gas × 0.183 kg, plus estimates for flights, food and shopping. The calculator on this page does this for you using UK government and Ember factors.
What is a good carbon footprint?
Research on 1.5 °C-aligned lifestyles puts the target at about 2–2.5 t CO₂e per person by 2030, 1.4 t by 2040 and 0.7 t by 2050. Most people in high-income countries are at 7–15 t today, so the gap is large.
Which carbon footprint calculator is most accurate?
No calculator is precise for an individual. The most useful ones use recent, region-specific emission factors, ask for your actual kWh and kilometres, and show their factors. Expect results from different tools to differ noticeably because of scope and assumptions.
What is the biggest part of most people’s carbon footprint?
For most people in rich countries it is transport (car use and especially flying), then home energy and food. A single long-haul return flight can outweigh months of other savings.
Sources
- Greenhouse gas reporting: conversion factors 2025, UK Department for Energy Security and Net Zero (DESNZ), 2025
- 2025 GHG conversion factors methodology paper, DESNZ, 2025
- 2025 DEFRA emissions factors update: what it means for business travel, Thrust Carbon, 2025
- Global Electricity Review 2026, Ember, 2026
- United States electricity data, Ember, 2026
- Electricity 2026: emissions, International Energy Agency, 2026
- Analysis: UK renewables enjoy record year in 2025, Carbon Brief, 2026
- Annual electricity review 2025: greenhouse gas emissions, RTE, 2026
- eGallon methodology (updated January 2016), US Department of Energy, 2016
- Life-cycle greenhouse gas emissions from passenger cars in the EU: a 2025 update, ICCT, 2025
- Scarborough et al., Dietary greenhouse gas emissions of meat-eaters, fish-eaters, vegetarians and vegans in the UK, Climatic Change, 2014
- Scarborough et al., Vegans, vegetarians, fish-eaters and meat-eaters in the UK show discrepant environmental impacts, Nature Food, 2023
- 1.5-Degree Lifestyles: Towards a Fair Consumption Space for All, Hot or Cool Institute, 2021
- 1.5-Degree Lifestyles: targets and options for reducing lifestyle carbon footprints, IGES, Aalto University and others, 2019
- Emissions Gap Report 2020, chapter 6: bridging the gap, the role of equitable low-carbon lifestyles, UNEP, 2020
- CO₂ emissions per capita, Our World in Data (Global Carbon Project data), 2025
- Global Carbon Budget 2025, Global Carbon Project, 2025
- Fuel poverty scenario modelling based on Ofgem price caps (typical domestic consumption values), Scottish Government, 2025
- How much electricity does an American home use?, US Energy Information Administration
- Ivanova et al., Quantifying the potential for climate change mitigation of consumption options, Environmental Research Letters, 2020
- How to use less energy and cut your bills, International Energy Agency
- Money-saving boiler challenge, Nesta, 2022
- IPCC Sixth Assessment Report, Synthesis Report, Summary for Policymakers, IPCC, 2023