Home energy
Renewable energy in 2026: where the world stands and what you can do at home
Solar and wind are now covering almost all new electricity demand, but global CO₂ is still rising. Here is the latest data and a practical look at the renewable options open to households.
Renewable energy in 2026 at a glance
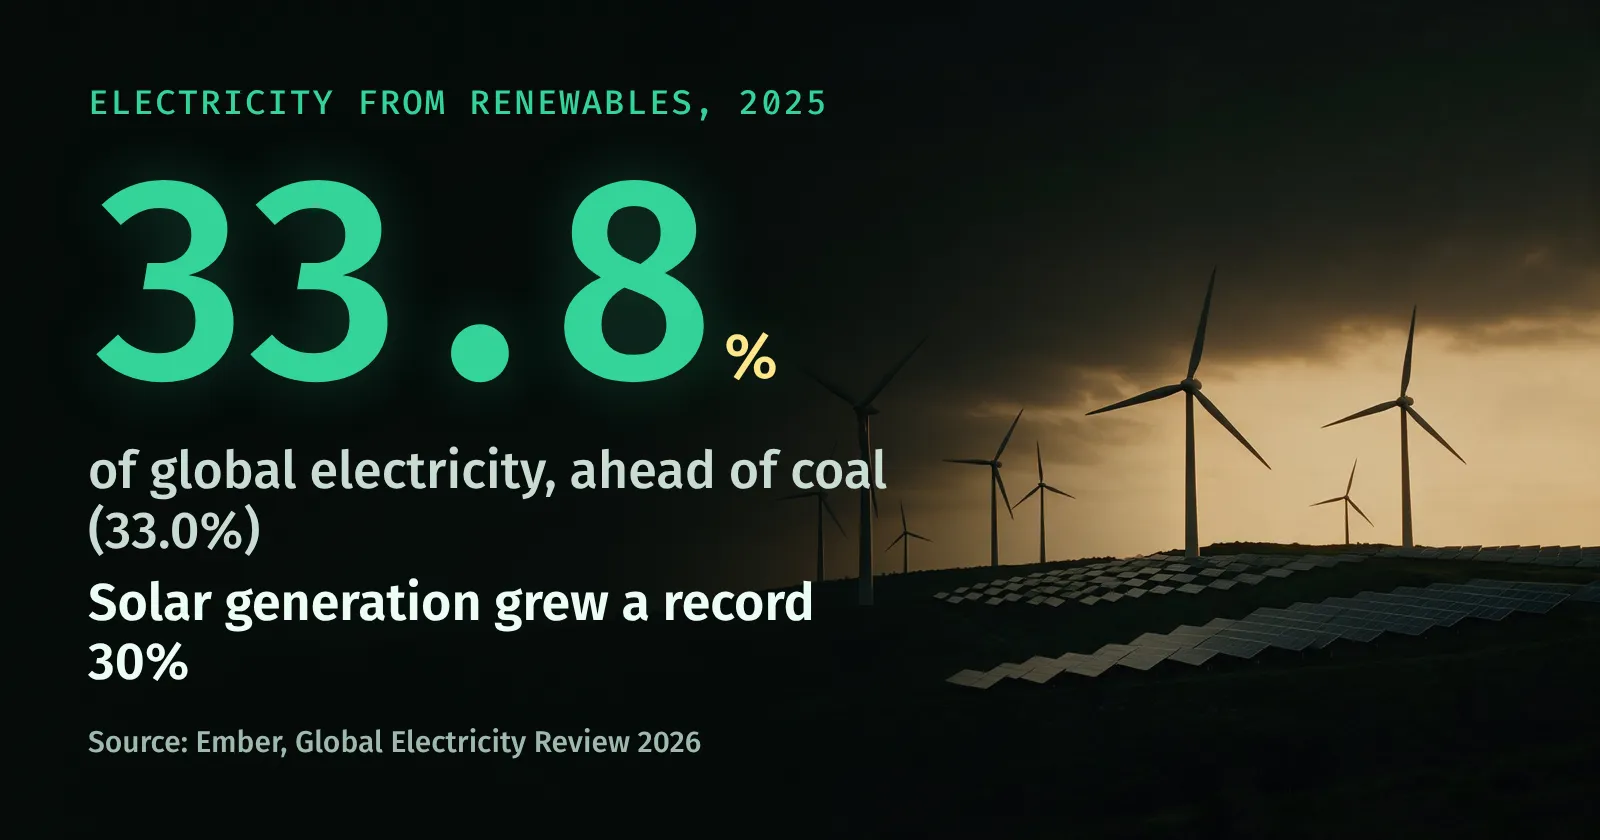
Renewables generated 33.8% of the world’s electricity in 2025 and, for the first time, more than coal, which fell to 33.0%. That is the headline of Ember’s Global Electricity Review 2026, the most complete annual dataset on global power. Counting nuclear, low-carbon sources produced 43% of global electricity.
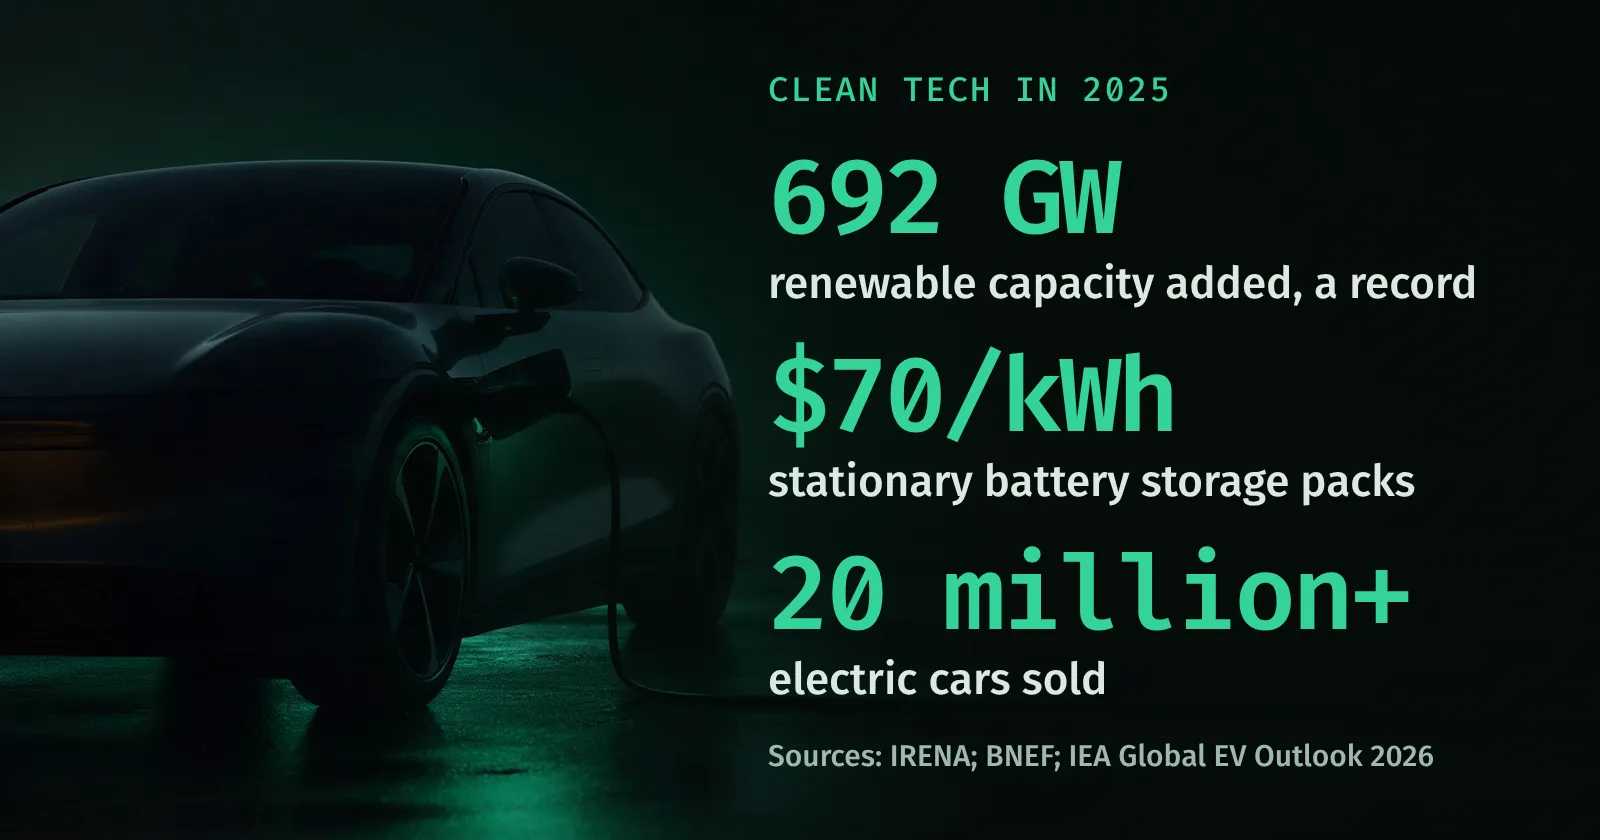
Solar did most of the work. Its output rose by a record 636 TWh (30%) to about 2,778 TWh, after a record 647 GW of new panels were installed. Solar and wind together met 99% of the growth in electricity demand, so fossil-fuel generation was flat for the first time since 2020. Then, in April 2026, wind and solar together produced more electricity than gas worldwide for the first time in any full month: 531 TWh, against 477 TWh from gas.
Global electricity mix in 2025
| Source | Share of generation |
|---|---|
| All renewables (hydro, solar, wind, bioenergy, other) | 33.8% |
| Coal | 33.0% |
| Nuclear | 8.9% |
| Solar | 8.7% |
| Wind | 8.5% |
| All low-carbon (renewables plus nuclear) | 43% |
Solar also overtook wind globally for the first time and is now close to nuclear. Hydropower remains the largest renewable source, making up most of the remaining renewable share.
Highlights by country
- China: wind and solar reached 22% of generation, and fossil power generation fell by 56 TWh. Combined with India, it was the first time this century that both countries cut fossil generation in the same year. See our China emissions page.
- India: installed 38 GW of solar, more than the United States for the first time, and fossil generation fell 3.3%. Solar is now India’s largest clean power source after overtaking hydro.
- United States: power-sector emissions rose 3.1% as higher gas prices pushed some generation back to coal, even though fossil generation rose only 0.9%.
What the renewables boom means for CO₂ emissions
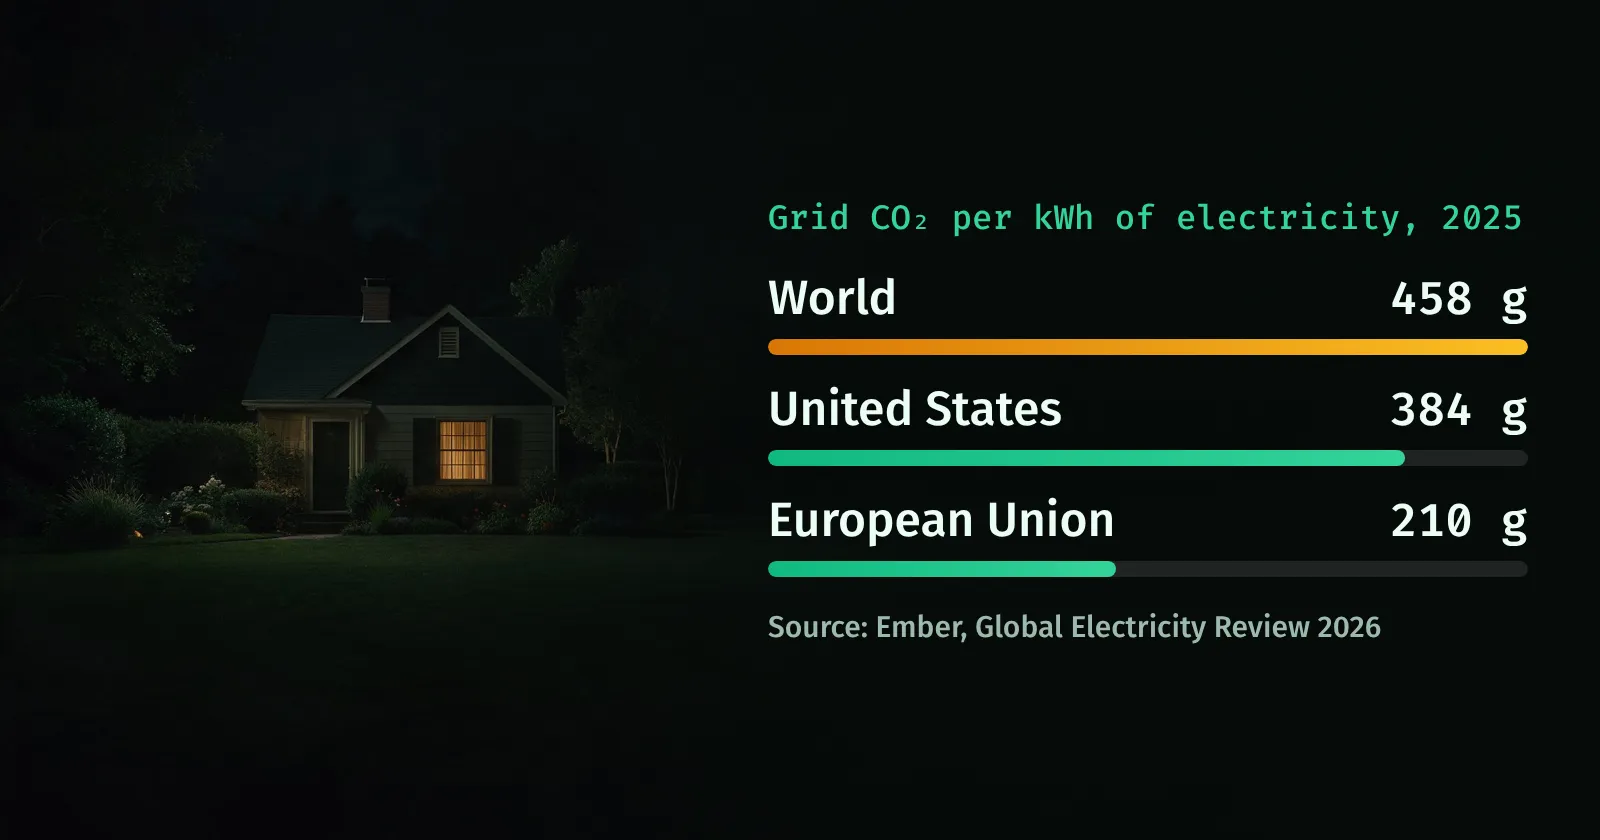
Clean power is now stopping the growth of power-sector emissions. Ember estimates global power emissions in 2025 were almost unchanged from 2024 (down about 0.04%), and the average carbon intensity of electricity fell 2.7% to 458 g CO₂ per kWh, the largest drop in two decades.
That is not yet enough to cut total emissions. Fossil CO₂ from all sectors reached a record 38.1 billion tonnes in 2025, up 1.1%, and total CO₂ including land use was about 42.2 billion tonnes (Global Carbon Budget 2025). Transport, industry and heating still run mainly on oil, gas and coal. Those emissions fall when they switch to clean electricity: electric cars, heat pumps and electrified industry.
The timing matters. The Global Carbon Budget estimates about 170 billion tonnes of CO₂ remained from the start of 2026 for a 50% chance of limiting warming to 1.5 °C, around four years of current emissions. You can watch that total grow on the live CO₂ counter, and compare how fast different countries are cleaning up their power on the CO₂ emissions by country ranking.
Costs and the outlook to 2030
Renewables are spreading mainly because they are cheap. IRENA’s cost report found that in 2024 new onshore wind averaged $0.034 per kWh and new utility-scale solar $0.043 per kWh, and that 91% of newly commissioned utility-scale renewable capacity produced power more cheaply than the cheapest new fossil-fuel option. Storage is following: BloombergNEF’s 2025 survey put average lithium-ion battery pack prices at a record low of $108 per kWh, 8% lower than in 2024.
The IEA’s Renewables 2025 report expects about 4,600 GW of new renewable capacity worldwide between 2025 and 2030, roughly equal to the combined power generation capacity of China, the EU and Japan today. Solar accounts for around 80% of that, and China for nearly 60%. The IEA did lower its forecast by about 5% compared with a year earlier, mainly because of policy changes in the United States and China, so growth is strong but not guaranteed.
Renewable energy options for your home
Households can take part in three ways: make their own clean power, buy it, or electrify heating so that the cleaner grid cuts their emissions. Before spending on any of them, cut waste first; the steps in how to save energy at home make every option below smaller and cheaper.
| Option | Suits | Upfront cost | What it changes |
|---|---|---|---|
| Renewable tariff | Everyone, including renters | None to low | Who you buy from; impact depends on how it is sourced |
| Community or shared solar | Renters, flats, shaded roofs | Low to medium | Helps fund new local projects |
| Rooftop solar | Owners with a sunny roof | Medium to high | Cuts grid imports during the day |
| Home battery | Solar homes, time-of-use tariffs | Medium to high | Shifts solar or cheap power into the evening |
| Heat pump | Owners replacing a boiler or furnace | High (grants in some countries) | Moves heating onto electricity |
Rooftop solar: what decides the payback
Typical prices give a sense of scale. The Energy Saving Trust puts an average UK home system at about 4.5 kWp and £7,600 installed. In the US, Lawrence Berkeley National Laboratory found a median installed price of about $4.00 per watt for residential systems in 2024, before incentives, with cash purchases cheaper than loan-financed ones.
Whether solar pays back for you depends on five things:
- Yield: how many kWh each kW of panels produces where you live and on your roof’s angle and shading. The free PVGIS tool from the European Commission estimates this for most of the world.
- Self-use: how much of the output you use yourself. Daytime use, a heat pump, an EV or a battery all raise it.
- Import price: each kWh you use from your panels avoids buying one from the grid.
- Export rate: what your supplier pays for surplus power. The Energy Saving Trust says around 12p per kWh is typical in Great Britain.
- Installed cost: including scaffolding, inverter replacement over the system’s life and any grants or tax relief.
Illustrative example (not a quote): say PVGIS estimates 3,800 kWh a year for a 4.5 kWp system. If you use 40% yourself at 25p per kWh and export the rest at 12p, the system is worth about £380 + £274 = £654 a year. At £7,600 that is a simple payback of about 12 years. Use 60% yourself and it falls to about 10 years. The CO₂ saved depends on your grid: about 800 kg a year at the EU average of 210 g per kWh, or about 2.5 tonnes at India’s 670 g.
- Get a yield estimate for your own roof from PVGIS or your installer.
- Download a year of hourly or half-hourly use so you know how much you use in daylight (see how to track your home energy use).
- Compare at least two quotes per kWp, and check installer certification and warranties.
- Check export tariffs and whether you need a smart meter to be paid for exports.
- Ask whether the system is battery-ready, even if you add a battery later.
Batteries, tariffs, community energy and heat pumps
Home batteries
A battery does not generate electricity; it moves it in time. It is most useful if you have solar and are out during the day, or if your tariff has cheap overnight or off-peak rates. Battery pack prices are falling fast, but home batteries still carry installation and inverter costs, so compare the extra self-use or tariff savings against the price.
Renewable tariffs
Switching tariff is the easiest step and works for renters. Look for suppliers that buy directly from named wind and solar generators or invest in new projects, and that publish their fuel mix. Tariffs backed only by cheap certificates from existing plants do little to change what gets built.
Community energy and shared solar
Community schemes let you invest in, or subscribe to, a local solar farm, wind turbine or hydro project. They suit people without a suitable roof. Returns and rules vary by country, so read the offer document carefully. In some countries, small plug-in “balcony” solar kits are another option for flats.
Heat pumps
For many homes, the largest renewable step is not panels but heating. Heat pumps are three to five times more efficient than fossil boilers, and the IEA finds they cut emissions by at least 20% compared with a gas boiler even on fossil-heavy grids, rising to about 80% on cleaner ones. As grids add more solar and wind, a heat pump’s emissions keep falling without you doing anything.
Questions and answers
What percentage of the world’s electricity is renewable?
In 2025 renewables generated 33.8% of global electricity, according to Ember’s Global Electricity Review 2026. Hydropower is the largest single renewable source, followed by solar (8.7%) and wind (8.5%). Including nuclear, low-carbon sources supplied 43%.
Are solar panels worth it for a home in 2026?
Often, if you have a sunny, unshaded roof, use a good share of the power yourself and can get a fair export rate. The Energy Saving Trust puts a typical 4.5 kWp UK system at about £7,600; in the US the median installed price was about $4.00 per watt before incentives in 2024. Get a yield estimate for your roof and at least two quotes, and note that the US 30% homeowner tax credit ended for systems installed after 2025.
Is solar power cheaper than fossil fuels?
For new power plants, usually yes. IRENA found that in 2024 new utility-scale solar averaged $0.043 per kWh and onshore wind $0.034, and that 91% of newly commissioned renewable capacity produced power more cheaply than the cheapest new fossil-fuel alternative.
Do green energy tariffs actually reduce emissions?
It depends on the tariff. The strongest ones buy power directly from specific wind or solar farms or help fund new ones. Tariffs backed only by low-cost certificates from existing plants do little to change what is built. Ask your supplier where the power comes from and how it is matched.
Can renters use renewable energy?
Yes. Renters can switch to a renewable tariff, join a community energy or shared solar scheme where available, and in some countries use small plug-in balcony solar kits. Cutting energy use first, for example with LEDs and better heating controls, also reduces emissions straight away.
Sources
- Global Electricity Review 2026, Ember, 2026
- Global Electricity Review 2026: 2025 in review, Ember, 2026
- For the first time, wind and solar generated more electricity than gas worldwide in April 2026, Ember, 2026
- Renewables 2025: analysis and forecast to 2030, IEA, 2025
- Renewable Power Generation Costs in 2024, IRENA, 2025
- Lithium-ion battery pack prices fall to $108 per kilowatt-hour, BloombergNEF, 2025
- Global Carbon Budget 2025, Global Carbon Project, 2025
- Solar panels: costs, savings and benefits explained, Energy Saving Trust, 2026
- U.S. Distributed Solar and Storage: 2025 data update, Lawrence Berkeley National Laboratory, 2025
- Explained: the clean energy provisions in the One Big Beautiful Bill, SEIA, 2025
- Photovoltaic Geographical Information System (PVGIS), European Commission Joint Research Centre
- The Future of Heat Pumps, IEA, 2022